Management System
2017
Overview
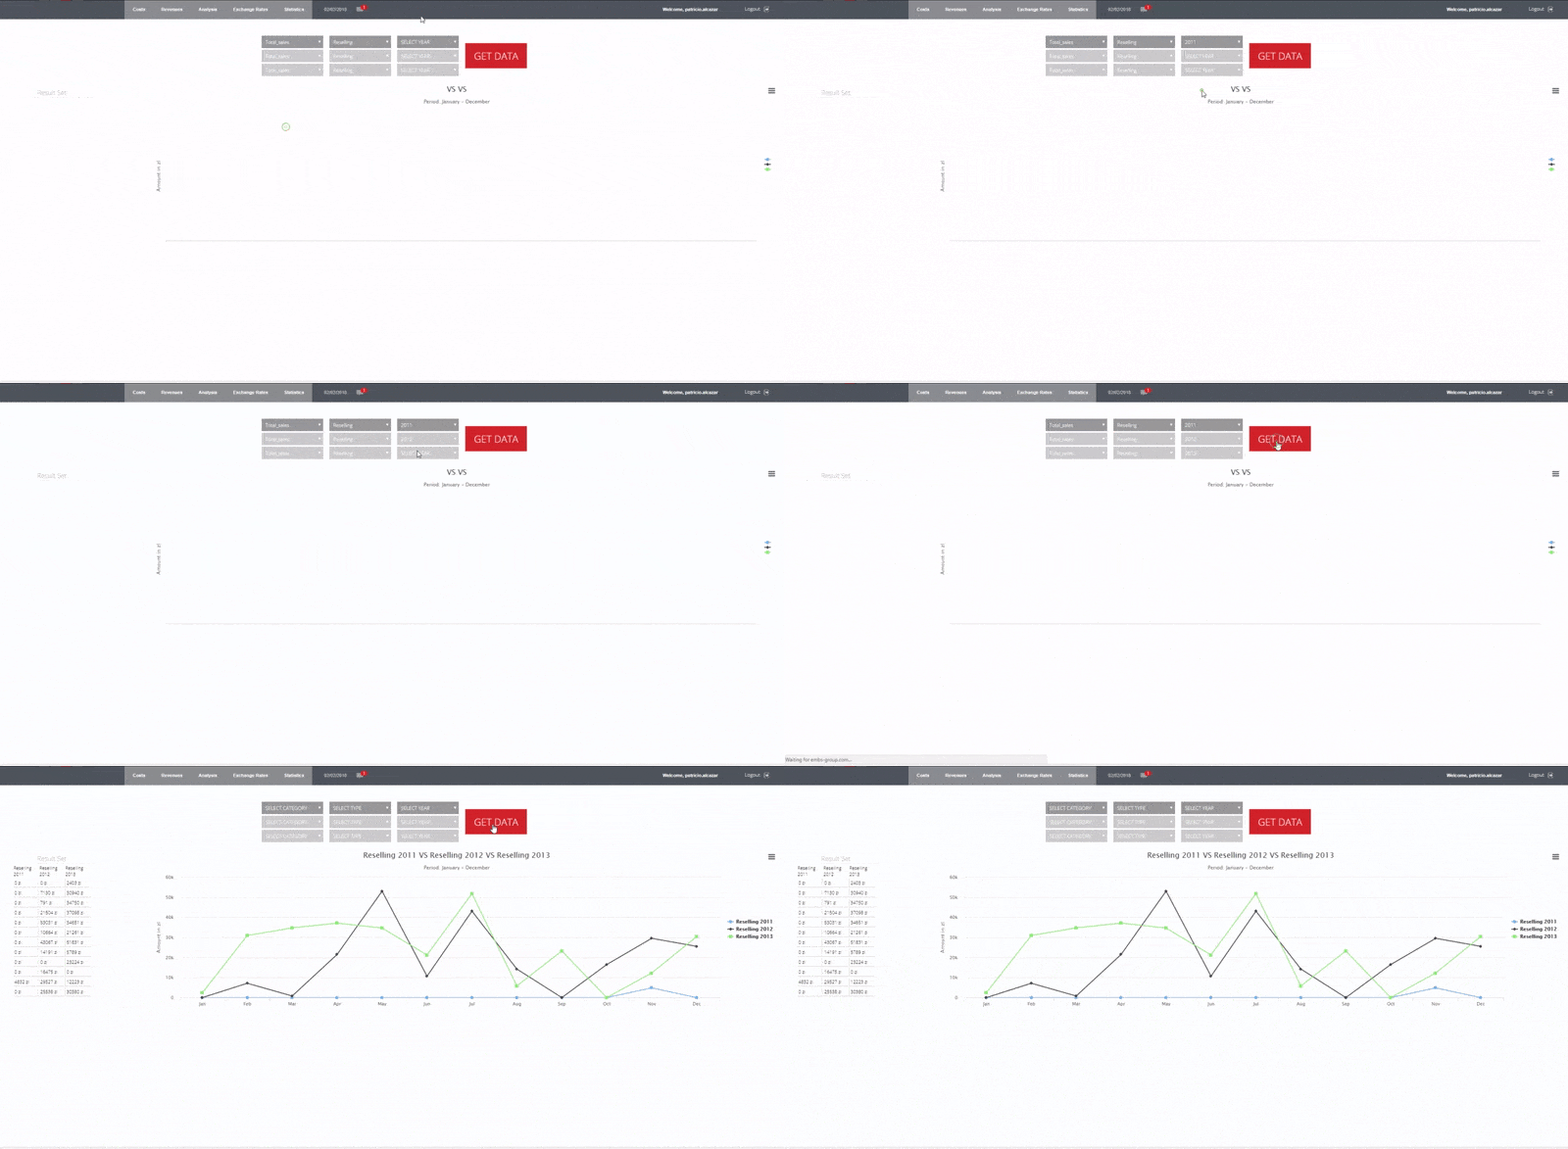
Department heads needed faster and better insight into departmental spending and expense allocation. The company was extremely reliant on Excel and the management team felt they were spending too much time on operational reporting. Their operational reports were not easily accessible and their internal reporting team was overwhelmed with reporting requests. The company needed a modern self-service reporting solution.
Scope
Qualitative & Quantitative Research, Analysis, Wireframing, Prototyping, Usability Testing.
Research
Defining Users
- Who are the Business Intelligence users?
- What information do they need?
- How and where will they use that information?
- What devices are they using it on?
- What is their comfort with, and level of understanding of the technology?
Information Needs
- What reports users access on a regular basis?
- What sources does their information come from?
- How current does their data need to be?
Operational Areas
- Financial Management
- Project Management
- Sales Development
- HR: Employees, Subcontractors & Candidates
- Analysis & Forecasting
User Personas
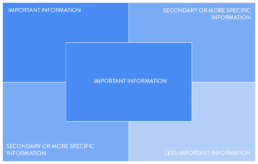
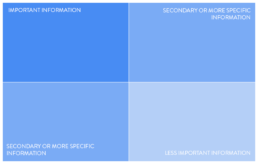
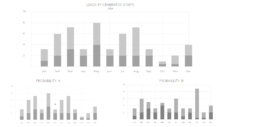
Visualization Patterns
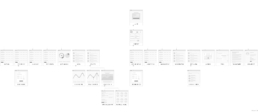
Information Architecture
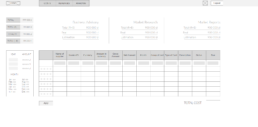
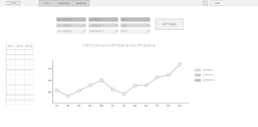
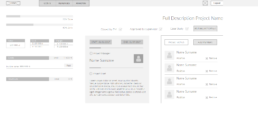
Wireframes
Session with stakeholders
Outcome
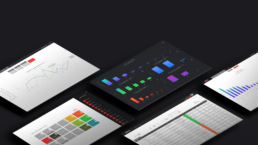
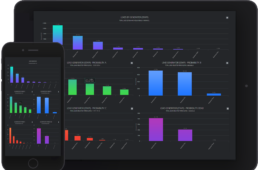
Provided the right information across 3 departments of the company ( Sales, Consulting & Market Research) in a format that was easily understandable to the user. It assisted to streamline the decision making, allowing more sophisticated analyses of data sets, providing real-time insights into what is and is not working within the company and informing decisions to maximize gains and limit losses.


